COLORFUL MEETING TOOLS EXPLAIN PROBLEM SOLVING IN A STRAIGHTFORWARD WAY

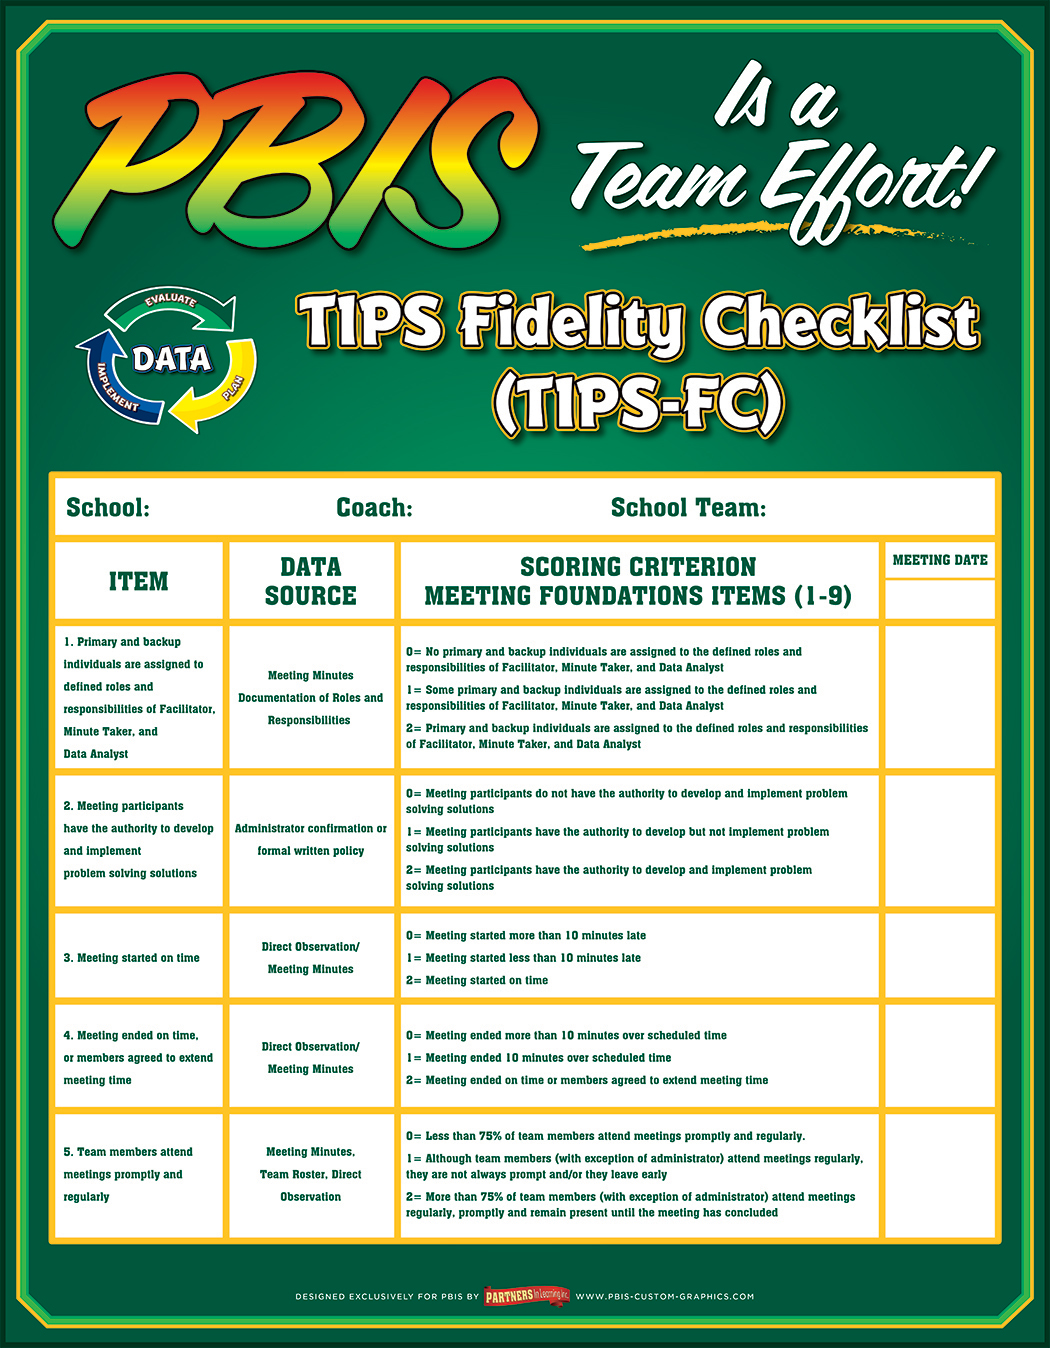
(TIPS) Team Initiated Problem Solving
R.H. Horner, J.S. Newton, A.W. Todd, B. Algozzine, K. Algozzine, D.L. Cusumano, & A.I. Preston (2015)
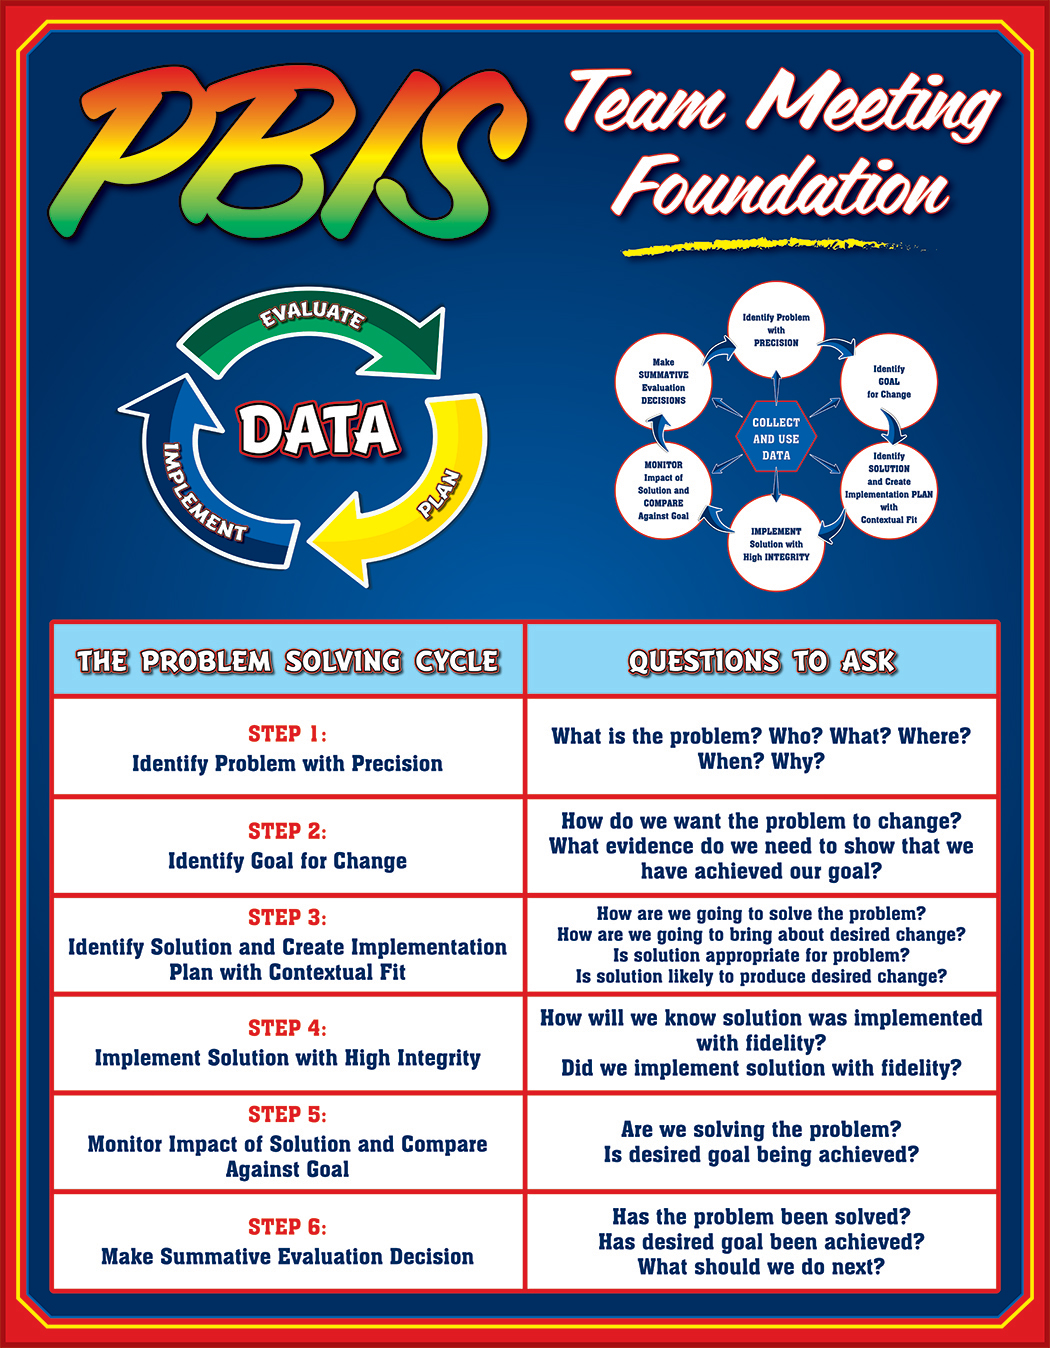
Effective decision-making teams follow a cyclical model that uses data to evaluate, plan and implement. The Team Initiated Problem Solving (TIPS) is a problem-solving framework used by MTSS teams to address academic and behavior challenges. This research-based model includes a focus of meeting foundations guided by a structured Meeting Minutes form and a six-step problem solving process.
*In collaboration with www.pbiscaltac.org
"Problem-Solving Cycle" Meeting Enhancement Tools
SET OF 8 PRE-DESIGNED DRY-ERASE WALL CHARTS 22 x 28” IN SIZE • #012 • $225.95 PER SET
Laminated for repeated use.
Ask us about our Quantity discount!!
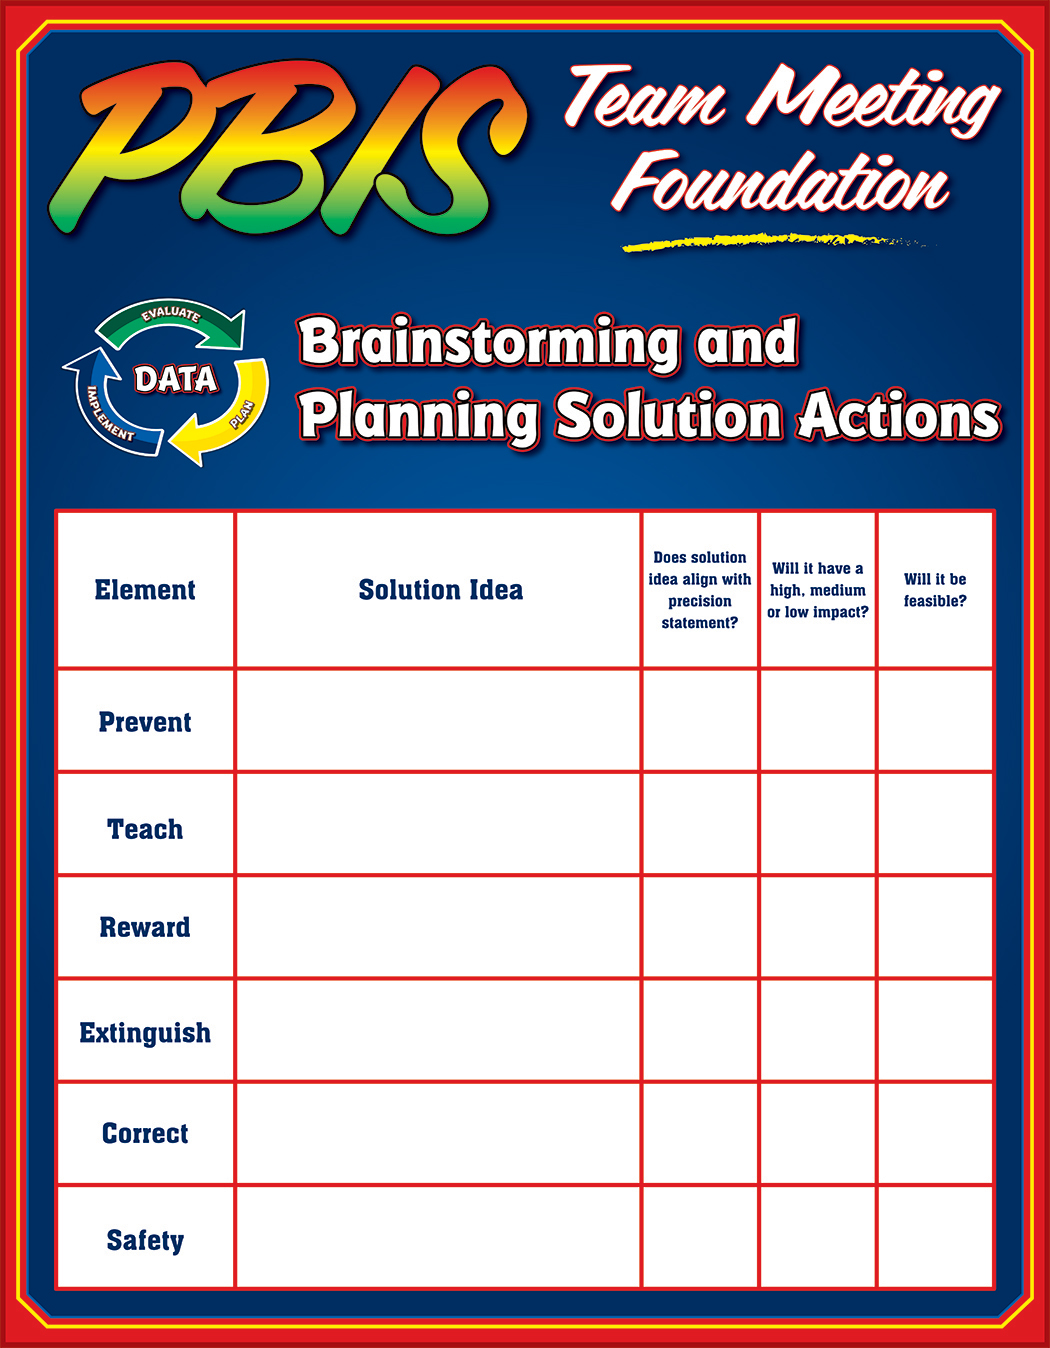
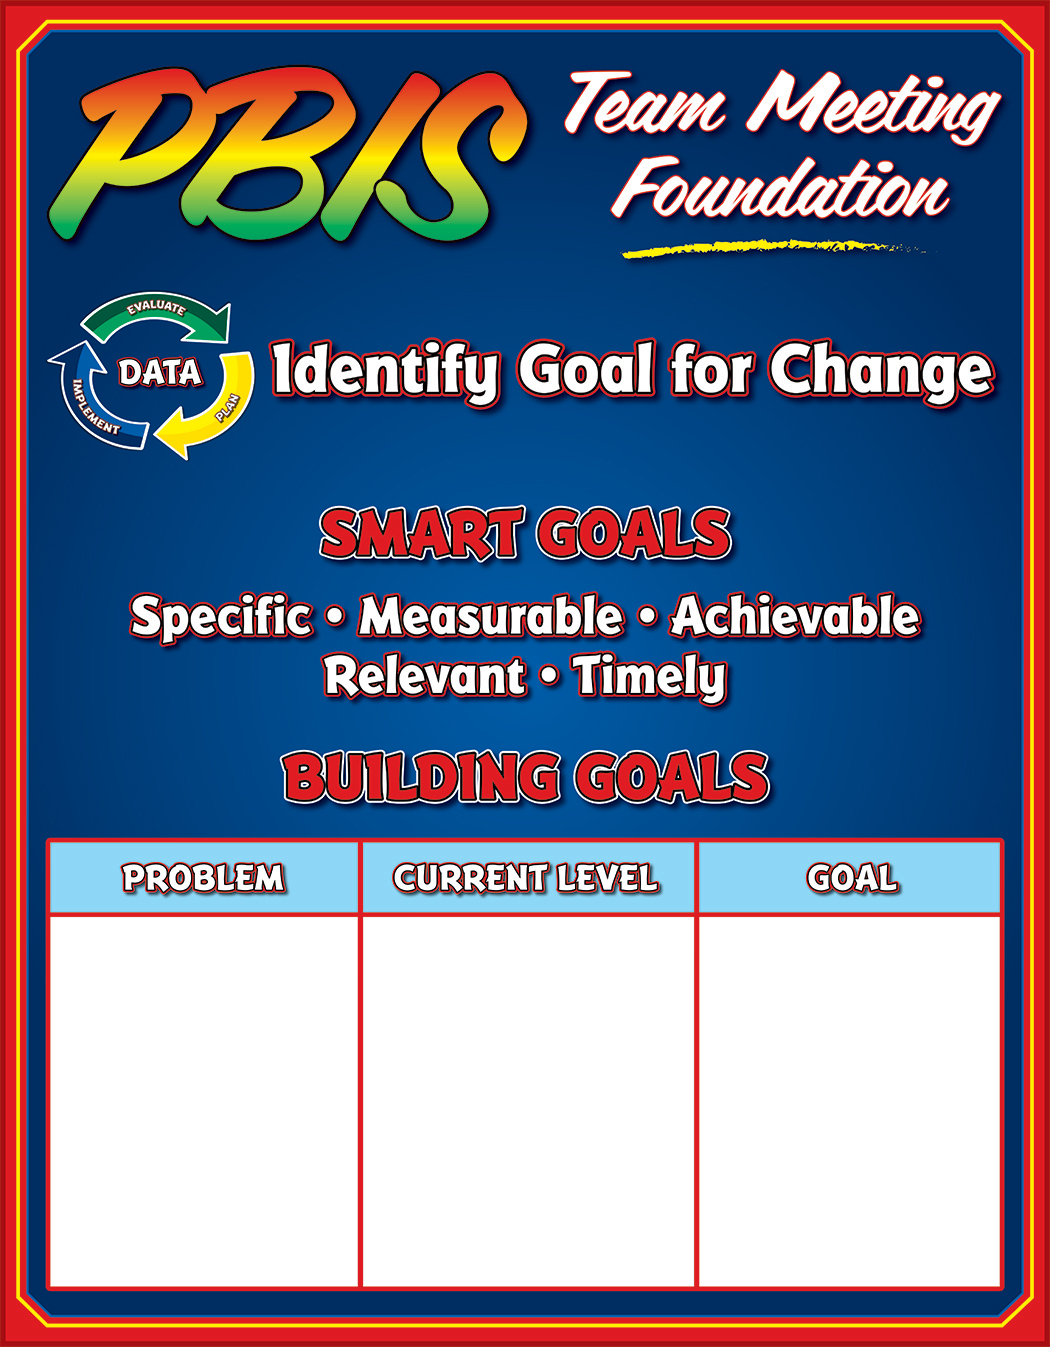
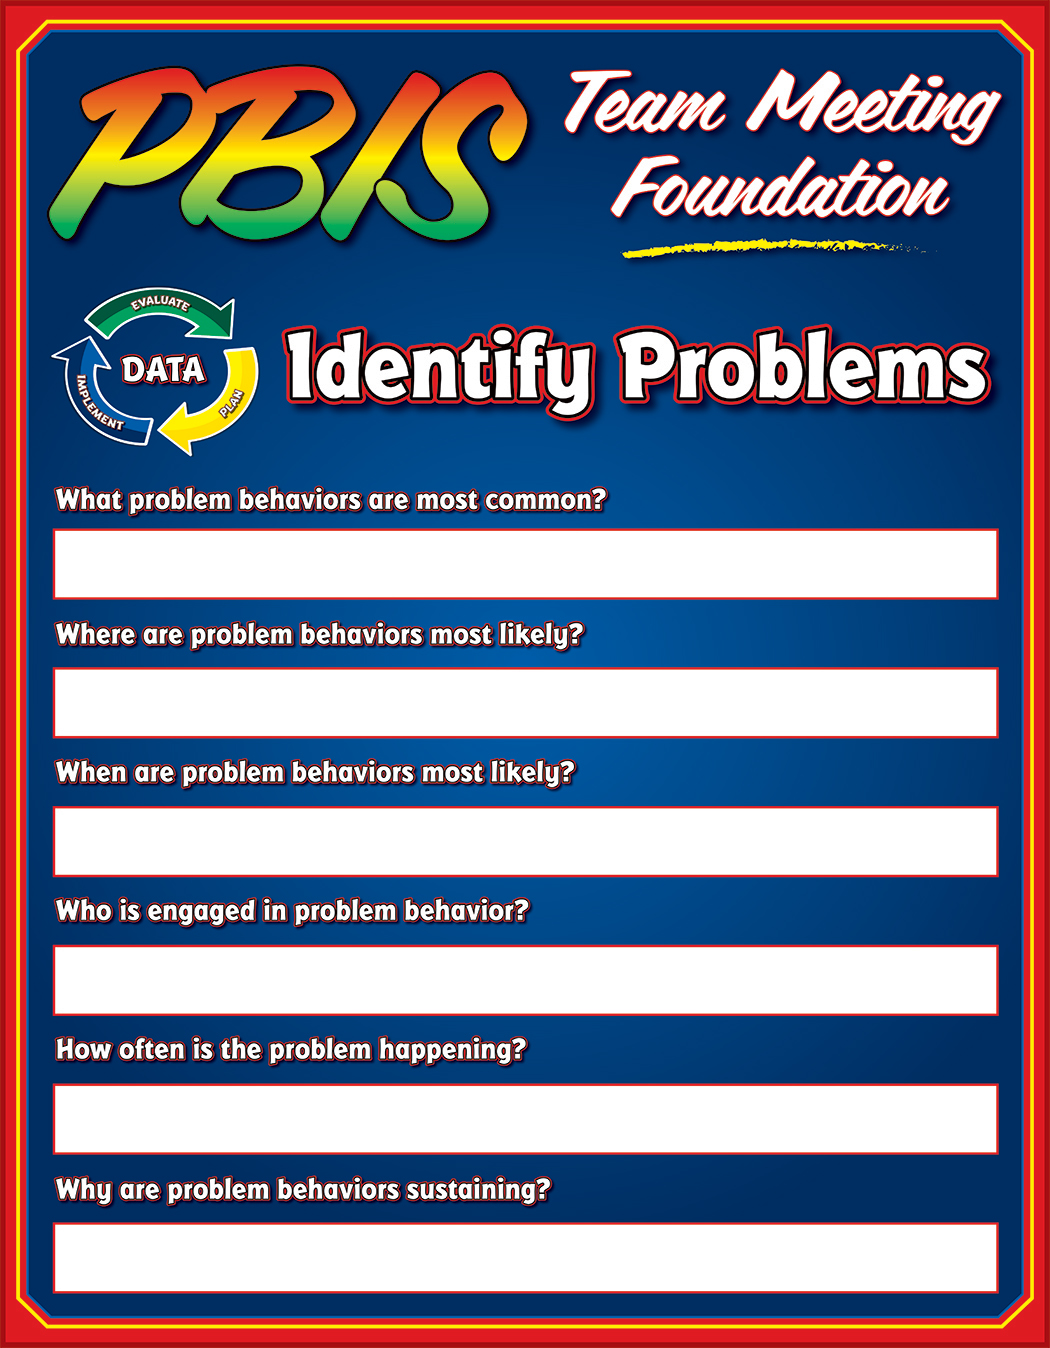
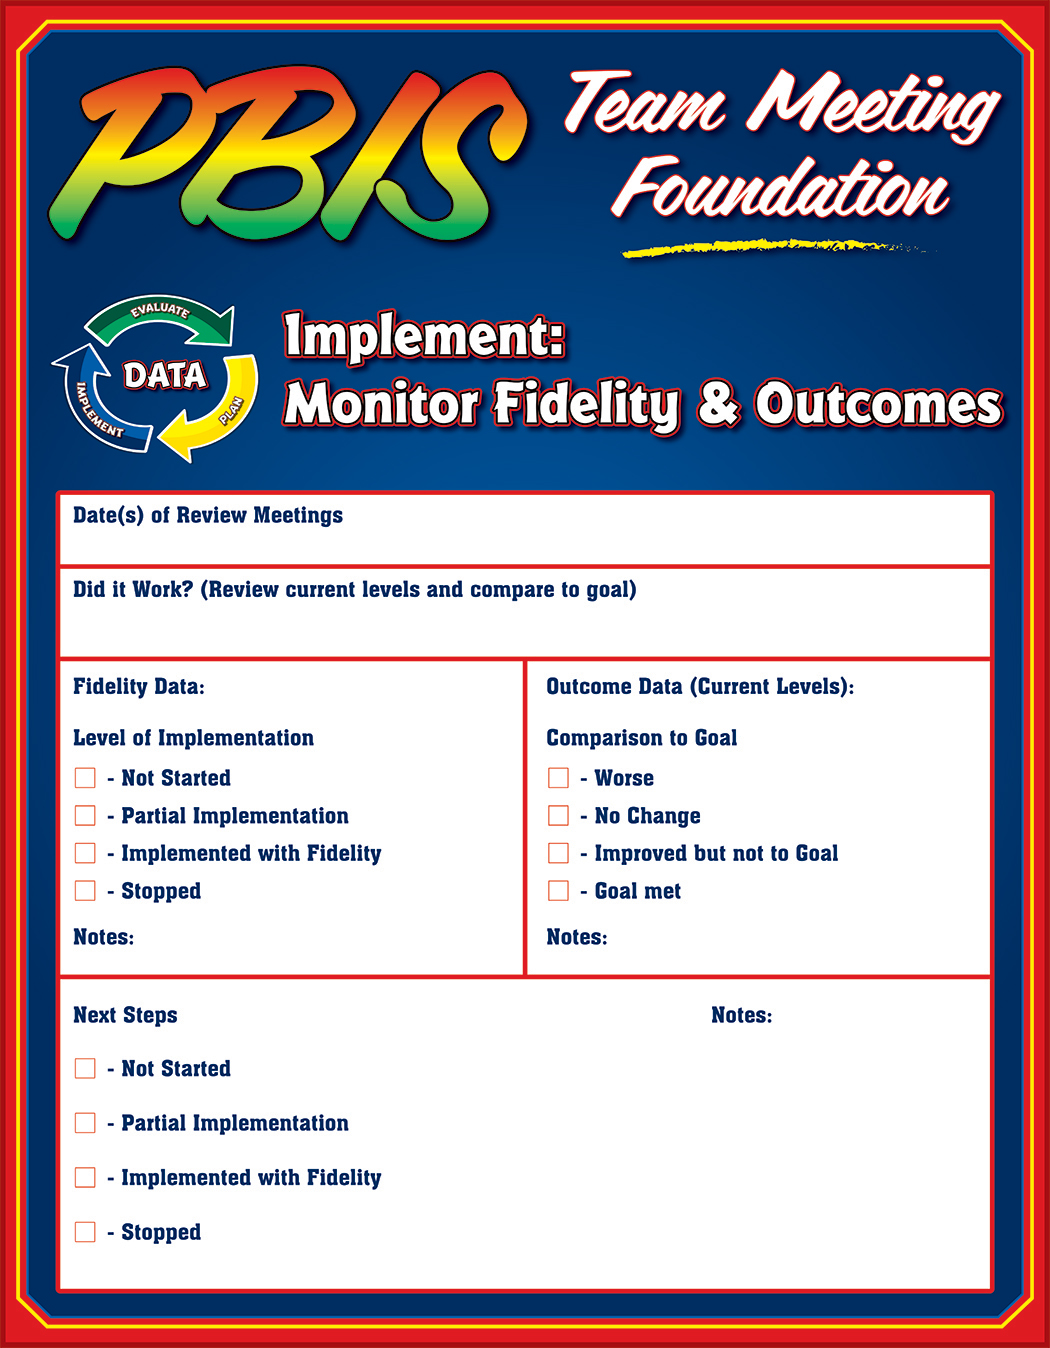
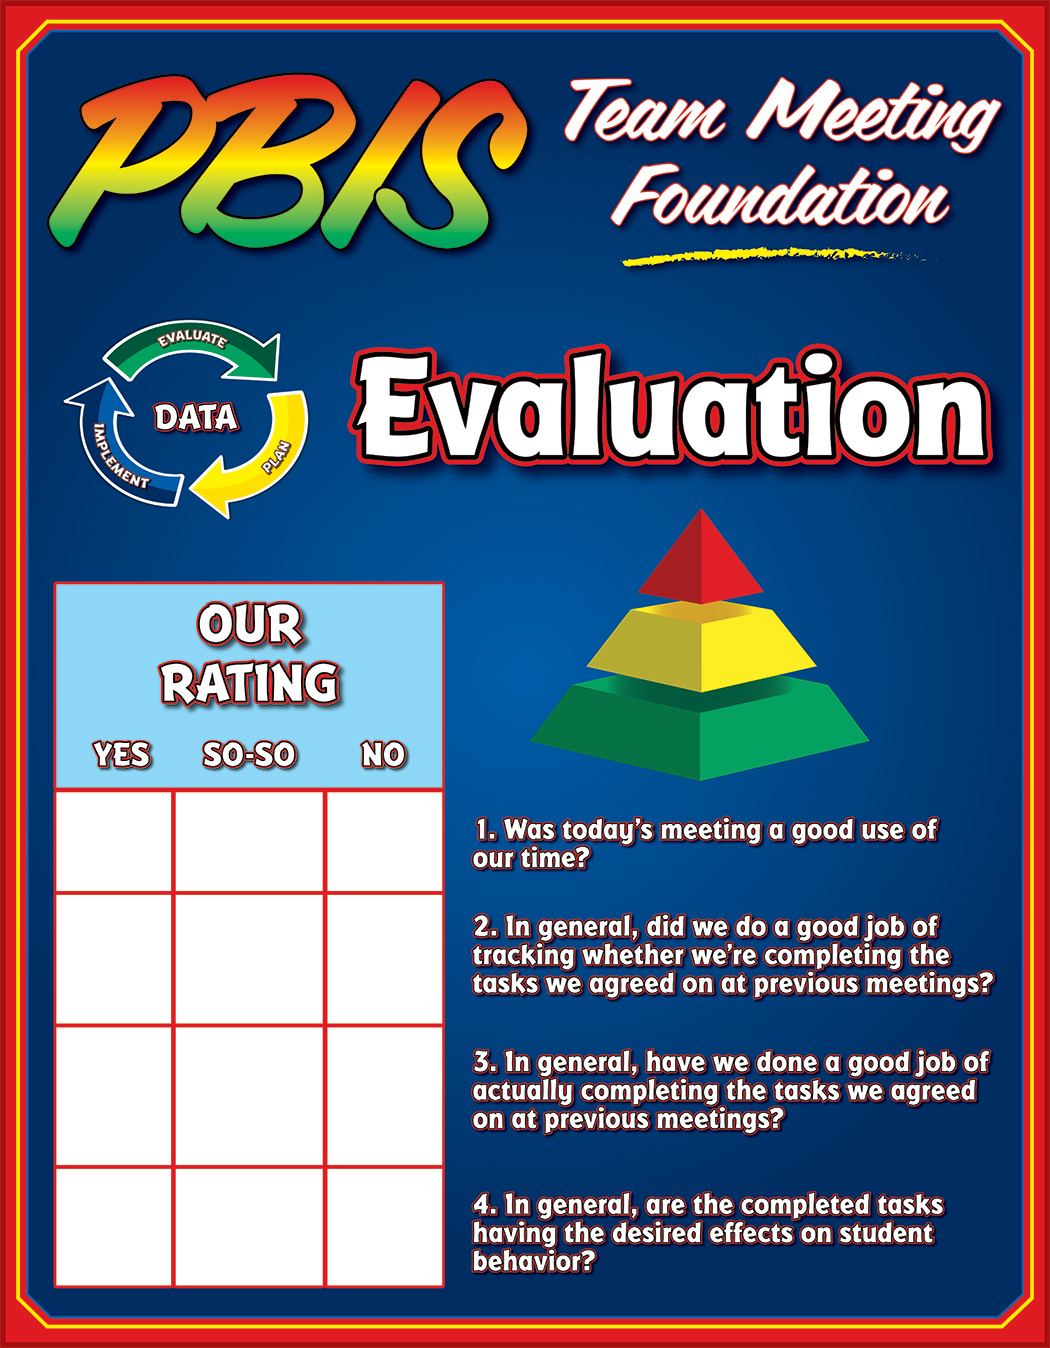
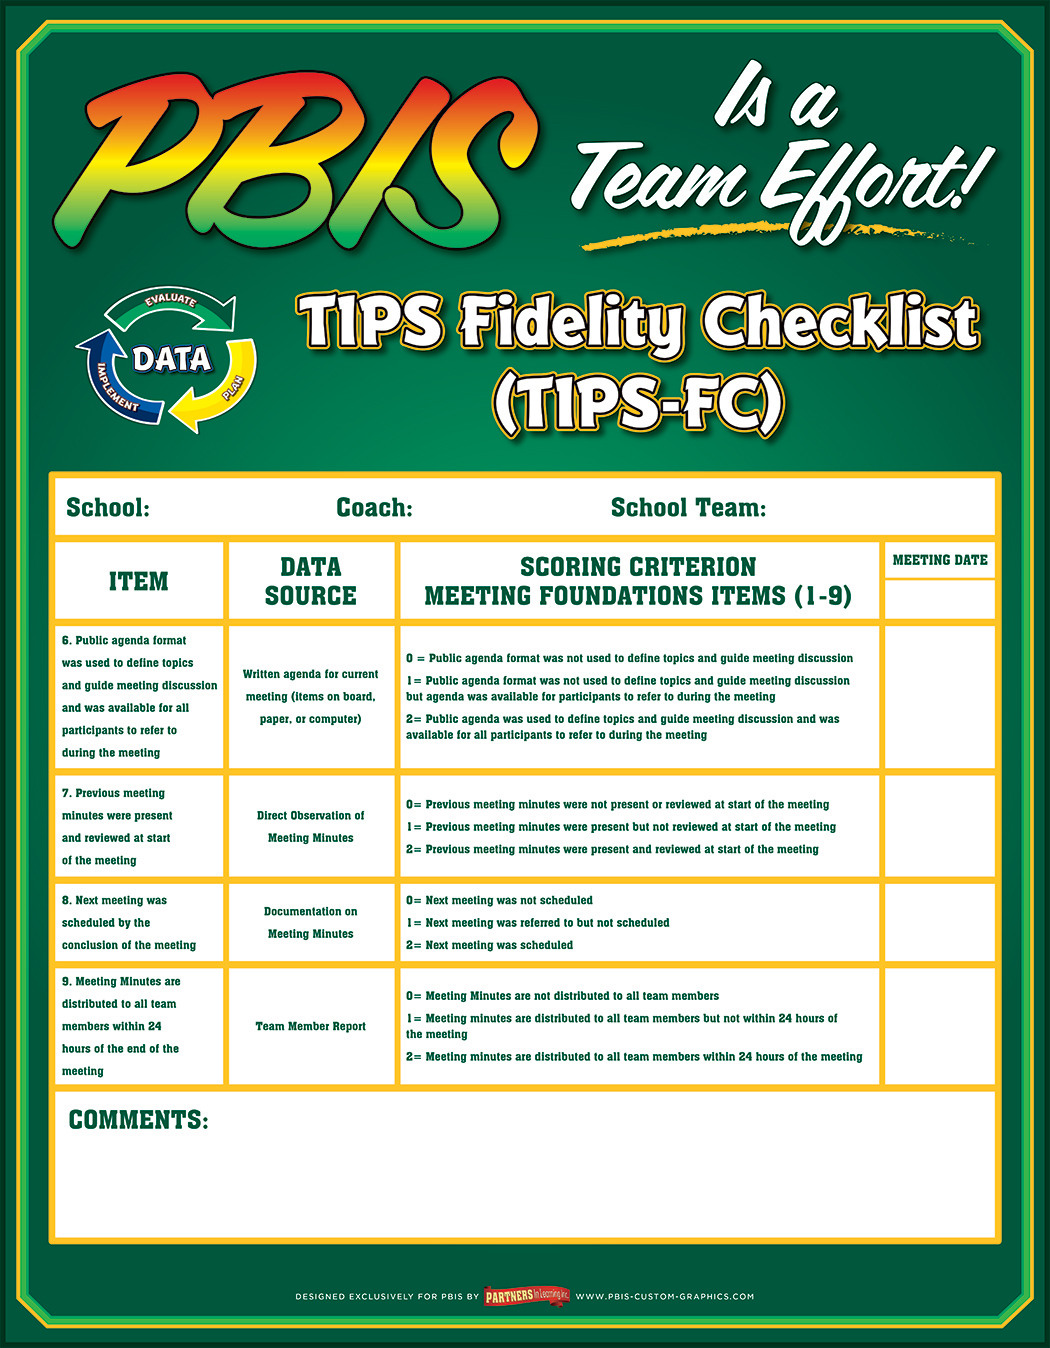

Using visual data wall charts is a great tool for guiding teams and coaches implementing, and sustaining best practice meeting foundations and using data for problem solving and decision-making.